AAM’s News Media Analyzer provides detailed data by geographic segments such as county, state, ZIP code and market for U.S. news media clients. Learn more in this tutorial.
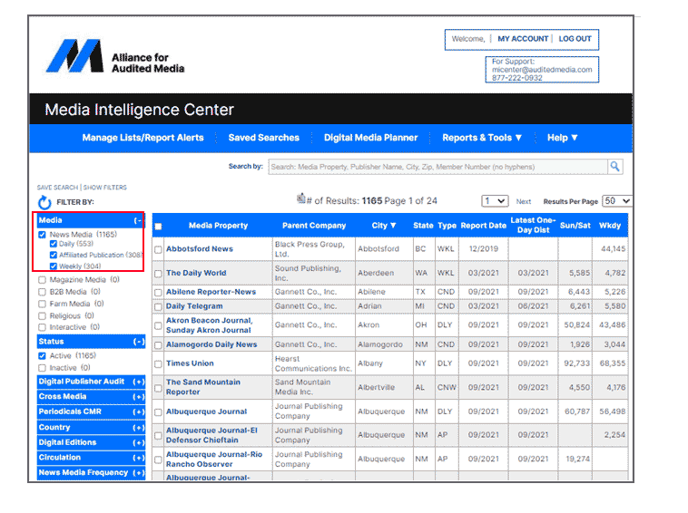
- The first step to analyzing geographic data is to select your desired newspaper titles. For this example, let’s look at newspapers published in New York City. First, select News Media under the Media filter.
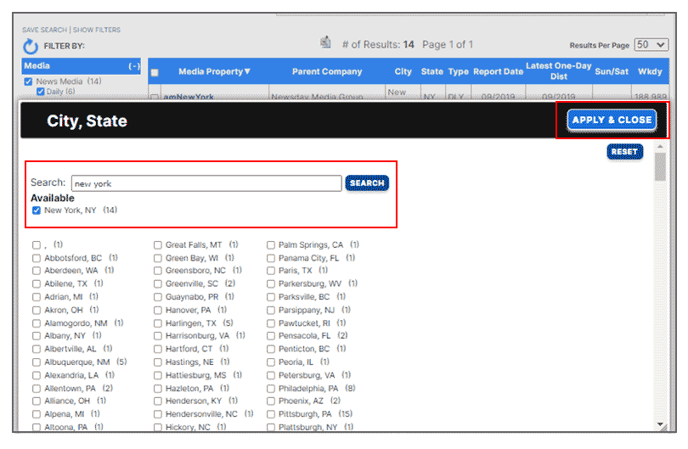
- Then click on City. In the pop-up window, check the box next to New York, NY or search and click the Apply & Close button.
- To analyze all titles in the list, click on the box next to Media Property and click the Analyze Data button.
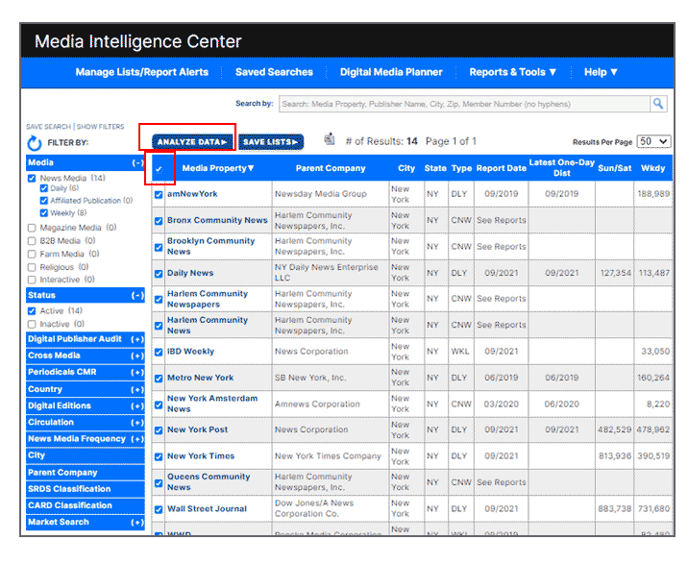
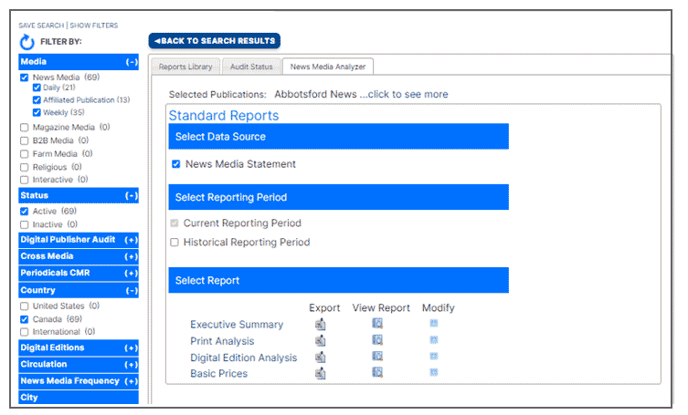
- From the tabs that appear, select News Media Analyzer.
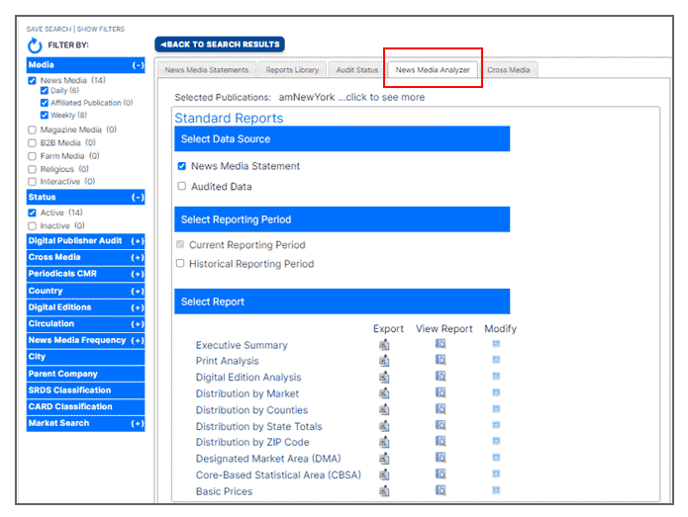
- In the News Media Analyzer, News Media Statement data is selected by default as the data source. You can also select Audited Data which includes audited data from June 2020 and before. Under the reporting period heading, Current Reporting Period is selected by default and is the most recent data. You can also select Historical Reporting Period for data going back ten years.
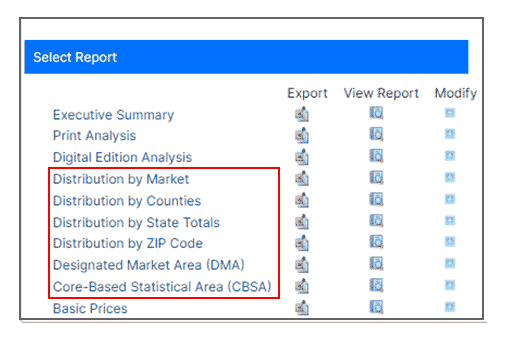
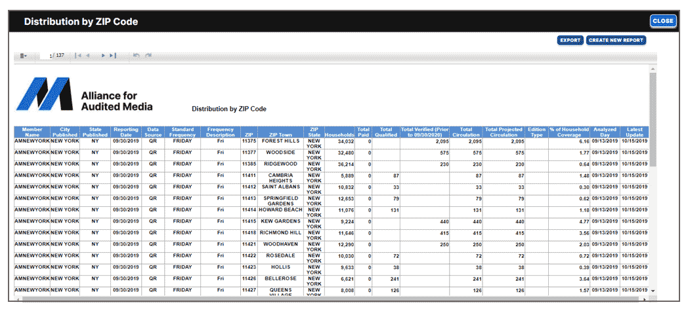
- Now select one of the geographic reports: Distribution by Markets, Distribution by Counties, Distribution by State Totals, Distribution by ZIP Code, Designated Market Area (DMA) or Core-Based Statistical Area (CBSA). You have three options to access your report: Export downloads the data into an Excel spreadsheet; View Report displays data in a window within the Analyzer and allows for further manipulation before downloading; and Modify allows you to customize the column headers and data appearing in the report.
Need more information? Visit the Media Intelligence Center Help section of this support center, send us your questions or request a customized training session.