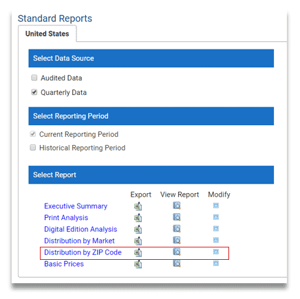
 AAM’s Newspaper Analyzer tool houses ZIP code-level data for local and national newspapers across North America. The Distribution by ZIP Code report offers a comprehensive breakdown of your selected newspapers’ distribution. View the table below for an explanation of each column of the Distribution by ZIP Code report.
Detailed instructions on how to file U.S. ZIP code data can be found here.

| Column Heading | Explanation |
| Member Name |
The edition name of the publication. This column may be filtered by member’s main and applicable affiliated publications. |
| City Published | The city of the publication. |
| State Published | The state of the publication. |
| Reporting Date | Ending date of the document. |
| Data Source |
Indicates whether the information was pulled from the AAM quarterly data report or the audit report. |
| Reporting Cycle |
Reporting cycle for the AAM quarterly data report or audit. QR = quarterly; AN = 12-month audit; BI = 24-month audit. |
| Standard Frequency |
The paragraph 3 ZIP code frequency day. |
| Frequency Description |
The paragraph 3 ZIP code frequency day. |
| ZIP | ZIP code |
| ZIP Town | Town associated with the ZIP code. |
| ZIP State | State associated with the ZIP code. |
| Households |
Number of households in the ZIP code (obtained from The Nielsen Company). |
| Total Paid | Publication’s total paid distribution by ZIP code. Note: Total paid includes: paid home delivery, paid single-copy sales and business traveler copies (i.e., hotel lobby copies.) |
| Total Qualified |
Publication’s total qualified nonpaid distribution by ZIP code. Note: Total qualified includes: home delivery address specific, home delivery market coverage, public access (retail/ business, dist. to apts., and racks & Other distribution), and other qualified (employee/independent contractor, education and university copies). |
| Total Circulation |
Publication’s total print distribution by ZIP code. Total circulation is the sum of total paid and total qualified distribution. |
| Total Projected Circulation |
The projection of the quarterly/audit period averages (in para 1) to the one day distribution figures in the para 3 ZIP report. This provides an estimate of what the quarterly/12-month average would be per ZIP. Note: Typically para 3 includes paid single-copy returns. Para 1 always excludes paid single-copy returns. |
| Edition Type | N/A |
| % of Household Coverage |
Compares the projected figure by ZIP code to the ZIP code household estimate. This figure is useful in determining how well the publication is penetrating a particular ZIP code. |
| Analyzed Day |
The representative day the publication has selected to analyze their distribution by ZIP code. For AAM purposes the publication has to select a representative Sunday (if applicable) and a representative week day (if applicable). |
| Latest Update |
The last date this report was updated. |